Registration
Register using this form!. The workshop is free to UPenn graduate students, postdocs, faculty, and staff, but registration is required and seating is limited.
The workshop will take place in the Holman Reading Room in the Biomedical library, and is free to UPenn graduate students, postdocs, faculty, and staff.
Overview
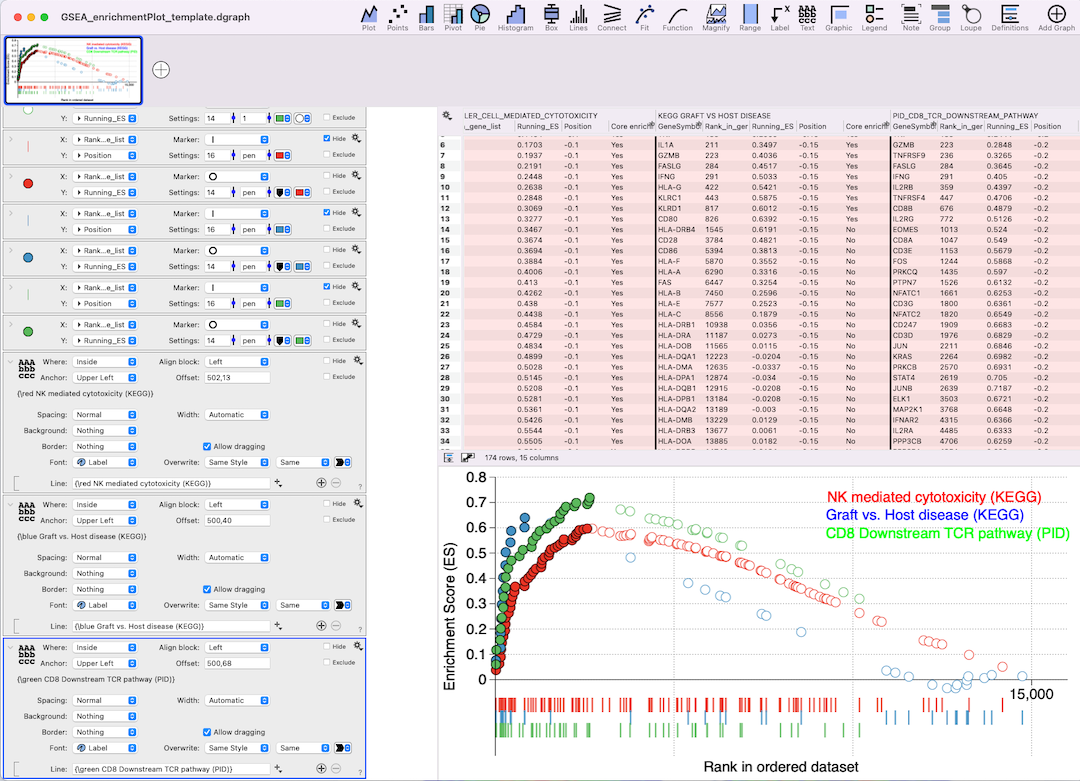
DataGraph is a macOS application that is like a Swiss army knife for data! DataGraph provides a ‘no code’ visual design environment for publication-quality graphics, allowing anyone to quickly and easily:
- build custom graphs
- carry out real-time data exploration
- create data analysis pipelines
- apply curve fitting and drawing functions to your data
About your instructor
Dr. Pamela Schultz, CEO of Visual Data Tools, Inc.
Dr. Schultz is a scientist, engineer, and data enthusiast. She has an M.S. and Ph.D. in Environmental Science & Engineering and an undergraduate degree in Chemistry. Her primary mission is to promote DataGraph to the scientific and engineering community. She frequently conducts online webinars and tutorials on data analysis and visualization.
Workshop details
Morning
Goal – To provide a solid understanding of the DataGraph user interface and approach. Learn how to combine and layer elements to create graphs for presentations and publications. Gain an understanding of settings and design approaches for making clean-looking, well-designed, graphs and figures.
Topic 1 - Data Structure and Organization
Topic 2 - Basic Graphing, Layering & Annotating
Topic 3 - Custom Graphs & Templates
Afternoon
Goal – To master techniques for quickly exploring and understanding data. Learn how to create reusable data processing pipelines. Connect to files using scripting tools to automate data analysis and graph creation. Connect to data or R scripts.
Topic 4 - Real-time Data Exploration
Topic 5 - Data Processing Pipelines
Topic 6 - Scripting tools
